텍스트 데이터 마이닝
데이터분석의 목적
1. 현상을 수치로 표현(증명)
2. 유의미한 변수를 발견하는 것
3. 수익 창출을 위한 모형 개발
KoNLP 사전의 종류
KoNLP에는 3종류의 사전이 포함되어 있으며 각 사전을 사용하기 위해 다음 명령어를 입력
useSystemDic() # 시스템 사전
useSejongDic() # 세종 사전
useNIADic() # NIADic 사전
문재인 대통령 출마 연설문 단어 빈도 분석
Ⅰ. 토큰을 이용한 분석
1. 전처리
setwd("작업 경로명") # 작업 경로 설정
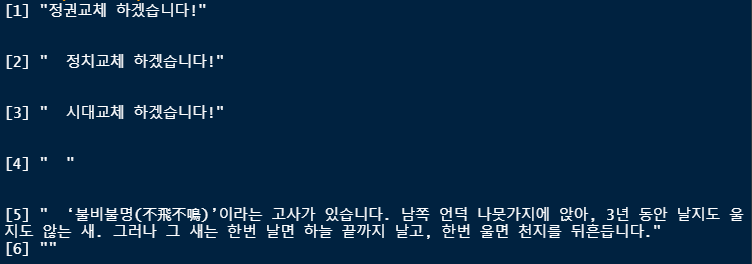
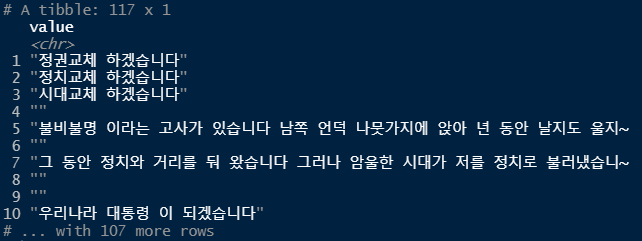
raw_moon <- readLines("speech_moon.txt", encoding="UTF-8") # 파일을 문장단위로 읽어와 raw_moon변수에 저장
head(raw_moon)
library(stringr) # 문자열 처리를 쉽게 할 수 있도록 해주는 패키지
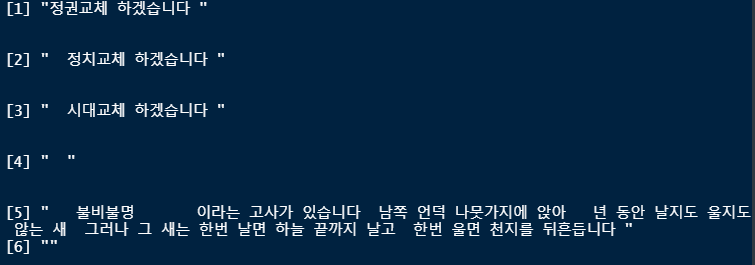
moon <- raw_moon %>% str_replace_all("[^가-힣]", " ") # 문장에서 한글만 가져와 moon변수에 저장 (한글이 아니라면 공백으로 변환)
head(moon) # 공백이 많이 출력됨(보기 안좋음)
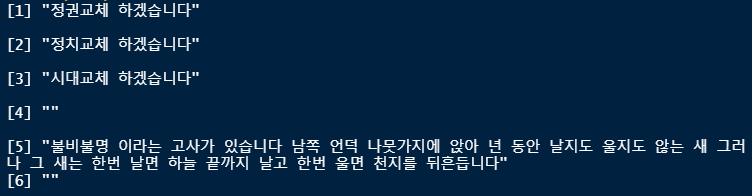
moon <- moon %>% str_squish() # 공백을 깔끔하게 정리
head(moon)
library(dplyr) # 데이터 처리에 특화된 패키지
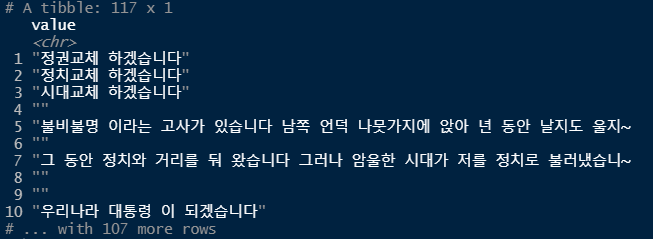
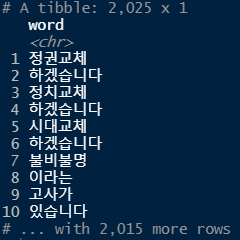
moon <- as_tibble(moon) # tibble 자료형을 사용하게 되면 확인할 수 있는만큼만 출력됨
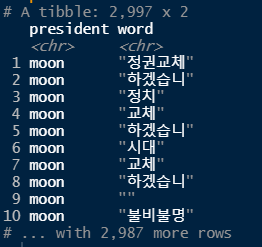
moon # attribute : value -> unnest_tokens()의 input의 값이 됨
2. 토큰화 하기 (word 단위)
library(tidytext) # 문자열을 정돈
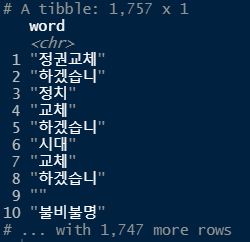
word_space <- moon %>%
unnest_tokens(input=value, output=word, token="words") # words는 조사가 붙어있는 형태(단어)
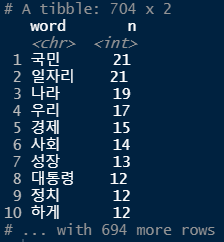
word_space # attribute : word -> count()의 첫번째 매개변수가 됨
3. 단어 빈도 분석하기
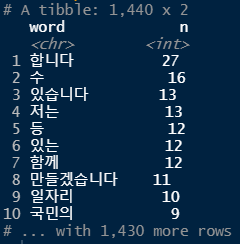
word_space <- word_space %>% count(word, sort = T)
word_space
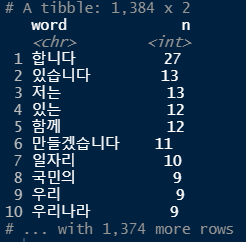
word_space <- word_space %>% filter(str_count(word) > 1) # 한글자 초과인 단어만 남기려고 함 (한글자는 의미가 없는 경우가 대부분)
word_space
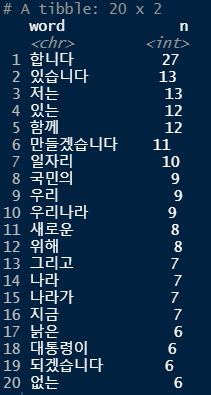
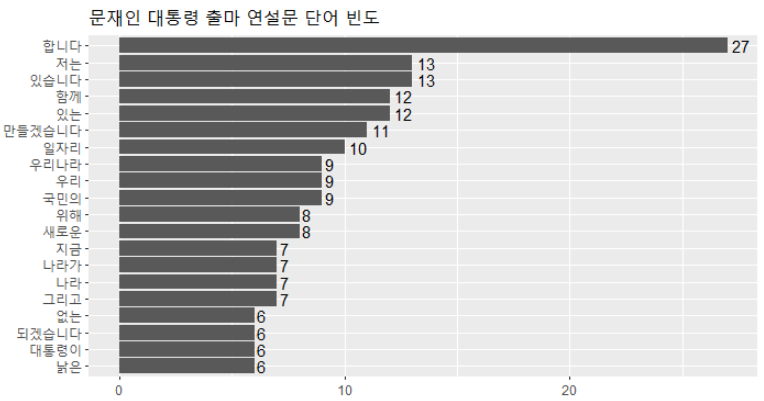
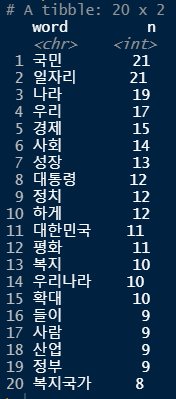
top20 <- head(word_space, 20) # 빈도수를 기준으로 상위 20개의 단어만 출력
top20
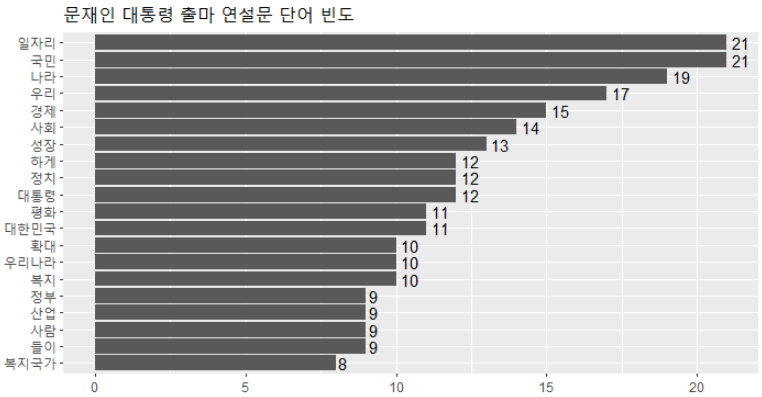
4. 결과 표현하기 -막대 그래프, 워드 클라우드-
library(ggplot2) # 데이터 시각화를 위한 패키지
ggplot(top20, aes(x=reorder(word,n), y=n)) +
geom_col() + # 막대 그래프
coord_flip() + # x축, y축 회전
geom_text(aes(label=n), hjust=-0.3) + # 각각의 막대 옆에 정확한 숫자(빈도) 출력
labs(title = "문재인 대통령 출마 연설문 단어 빈도", x = NULL, y = NULL) + # 그래프 제목, x축과 y축 표시 제거
theme(title=element_text(size=12)) # 그래프 제목 글자 크기 조절
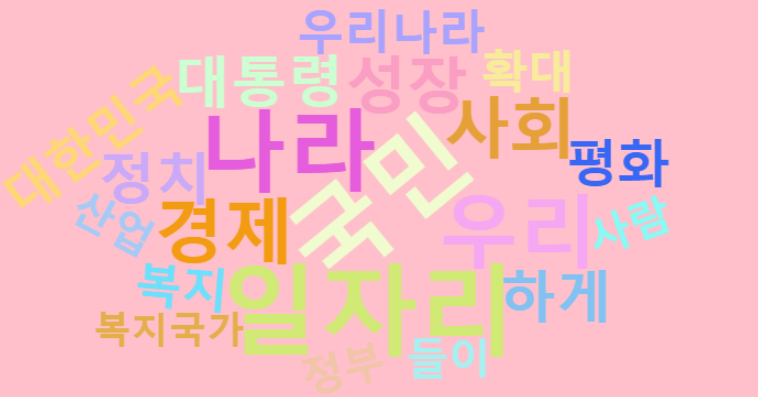
# 워드클라우드
library(wordcloud2)
wordcloud2(top20, color = "random-light", fontFamily = "나눔 고딕", size = 0.5, backgroundColor = "pink")
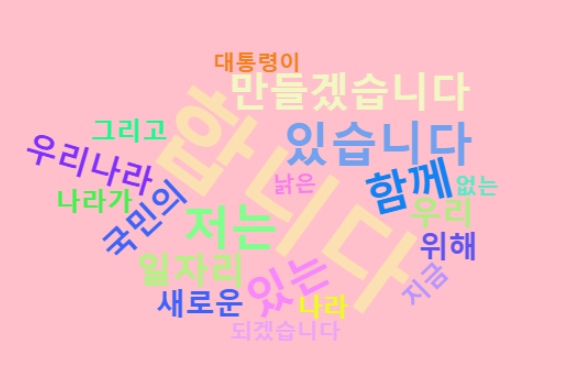
# 결과가 만족스럽지 않음 -> 형태소 분석을 통하여 더욱 정교하게 분석할 수 있음
Ⅱ. 형태소를 이용한 분석 (명사)
library(KoNLP)
useNIADic()
raw_moon <- readLines("speech_moon.txt", encoding="UTF-8") # 문장 추출
moon <- raw_moon %>% # 한글 외의 문자 제거 및 tibble로 변환
str_replace_all("[^가-힣]", " ") %>%
str_squish() %>%
as_tibble()
moon
word_moon <- moon %>% # 명사 추출
unnest_tokens(input=value, output=word, token=extractNoun)
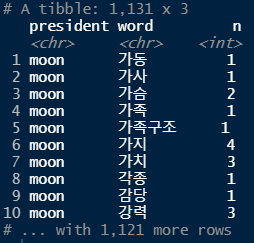
word_moon
word_moon <- word_moon %>%
count(word, sort = T) %>% # 빈도수 출력
filter(str_count(word) > 1) # 한자리 이하의 단어 제거
word_moon
top20 <- head(word_moon, 20) # 상위 20개 단어 추출
top20
ggplot(top20, aes(x=reorder(word,n), y=n)) +
geom_col() + # 막대 그래프
coord_flip() + # x축, y축 회전
geom_text(aes(label=n), hjust=-0.3) + # 각각의 막대 옆에 정확한 숫자(빈도) 출력
labs(title = "문재인 대통령 출마 연설문 단어 빈도", x = NULL, y = NULL) + # 그래프 제목, x축과 y축 표시 제거
theme(title=element_text(size=12)) # 그래프 제목 글자 크기 조절
# 워드클라우드
wordcloud2(top20, color = "random-light", fontFamily = "나눔 고딕", size = 0.5, backgroundColor = "pink")
문재인 대통령, 박근혜 대통령 연설문 비교 분석
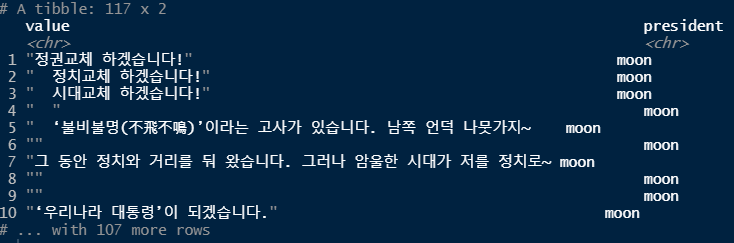
raw_moon <- readLines("speech_moon.txt", encoding="UTF-8")
moon <- raw_moon %>%
as_tibble() %>%
mutate(president = "moon") # "moon"이라는 컬럼 추가
moon
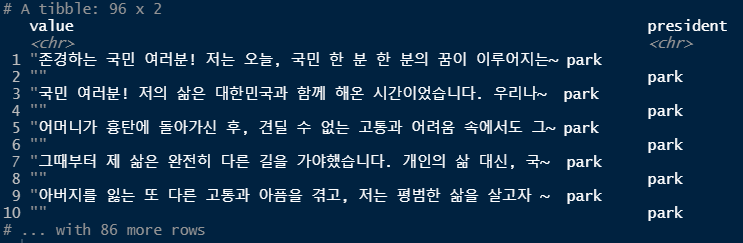
raw_park <- readLines("speech_park.txt", encoding="UTF-8")
park <- raw_park %>%
as_tibble() %>%
mutate(president = "park") # "park"이라는 컬럼 추가
park
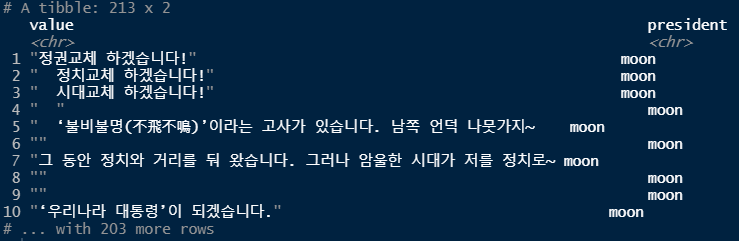
bind_speeches <- bind_rows(moon, park) # 2개의 데이터 합치기(행)
bind_speeches
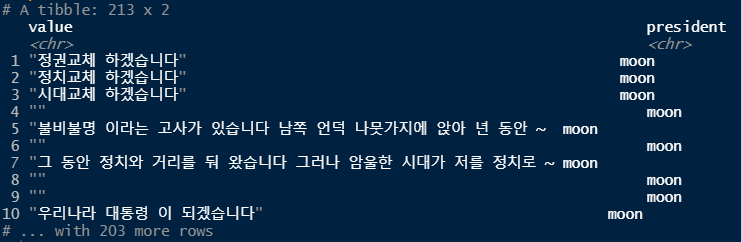
speeches <- bind_speeches %>%
mutate(value = str_replace_all(value, "[^가-힣]", " ")) %>% # 한글 외의 문자를 공백으로 치환
mutate(value = str_squish(value)) # 공백을 깔끔하게
speeches
speeches <- speeches %>%
unnest_tokens(input = value, output = word, token = extractNoun) # 명사를 토큰으로 뽑아내기
speeches
count_word <- speeches %>%
count(president, word) %>% # 단어 빈도수
filter(str_count(word) > 1) # 단어의 길이가 1 초과인 것만
count_word
# tibble Test -begin-
df <- tibble(x = c(1:10)) %>%
slice_max(x, n=3)
df
# tibble Test -end-
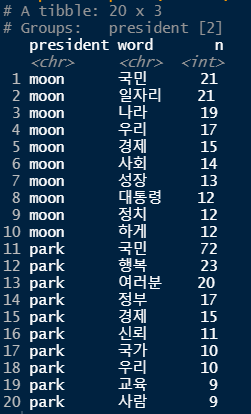
top10 <- count_word %>%
group_by(president) %>% # 대통령 별로
slice_max(n, n=10, with_ties = F) # 상위 10개씩, 순위 중복 없이
top10 %>% print(n = Inf)
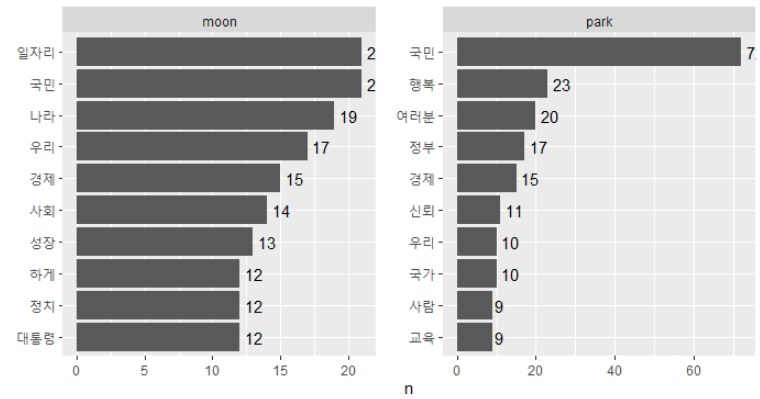
ggplot(top10, aes(x=reorder_within(word,n,president), y=n)) +
geom_col() + # 막대 그래프
coord_flip() + # x축, y축 회전
geom_text(aes(label=n), hjust=-0.3) + # 각각의 막대 옆에 정확한 숫자(빈도) 출력
facet_wrap(~president, scales = "free") + # 어느 대통령이 말한 단어인지 구분하기 위해)
scale_x_reordered() +
labs(x = NULL)
'데이터 분석 > R' 카테고리의 다른 글
| 데이터 분석[R] -15차시 (0) | 2021.07.15 |
|---|---|
| 데이터 분석[R] - 14차시 (0) | 2021.07.14 |
| 데이터 분석[R] - 12차시 (0) | 2021.07.12 |
| 데이터 분석[R] - 11차시 (0) | 2021.07.09 |
| 데이터 분석[R] - 10차시 (0) | 2021.07.08 |


